
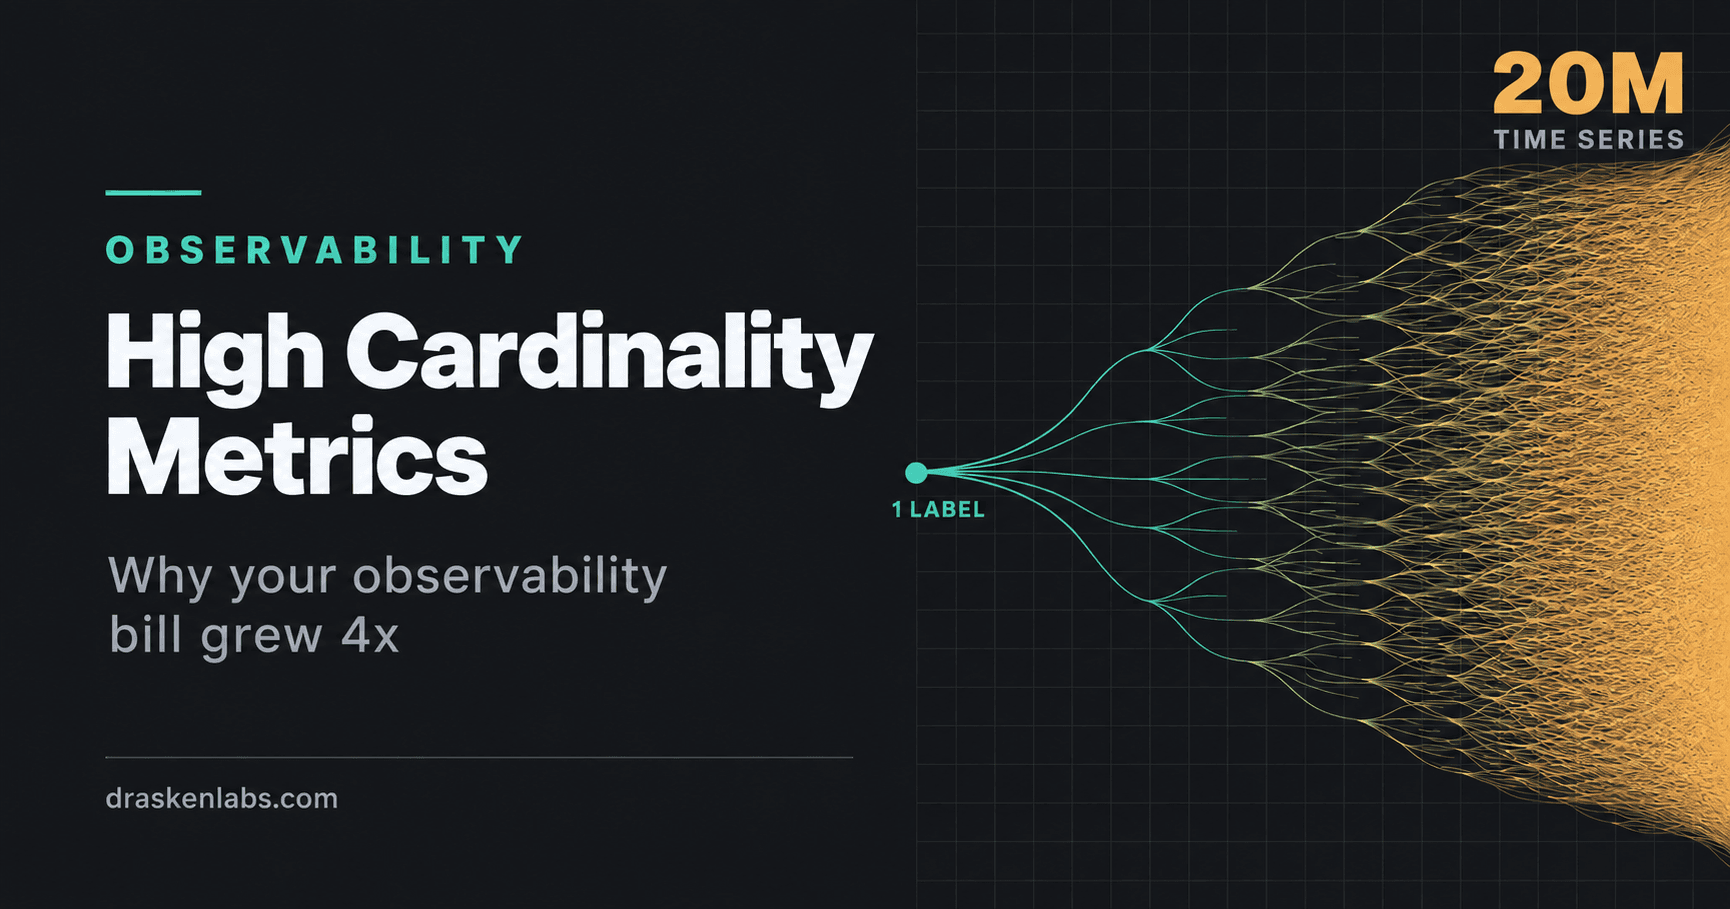
High cardinality metrics are the reason, almost every time.
Traffic grew 30% this year. The observability bill grew 400%. Nobody changed the vendor, nobody added a new tool, and no single person can explain what happened.
This is one of the most common infrastructure cost surprises we see, and it’s almost always the same cause. Observability platforms do not bill by traffic. They bill by the number of distinct things you ask them to remember. That number is cardinality, and it multiplies rather than adds.
Once you understand the multiplication, the fix is mechanical.
What high cardinality metrics actually are
A metric is not one number. A metric with labels is one number per unique combination of label values, and each of those combinations is a separate time series that has to be stored, indexed, and queried.
Take a request counter:
http_requests_total{service, endpoint, method, status}With 10 services, 20 endpoints, 4 methods, and 5 status codes, that’s 10 × 20 × 4 × 5 = 4,000 time series. Entirely fine.
Now someone adds customer_id to help debug a support ticket. You have 5,000 customers.
4,000 × 5,000 = 20 million time series, from one line of code.
The traffic didn’t change. The number of requests didn’t change. But your storage, your index size, your query latency, and your bill all changed by three orders of magnitude, and the commit that did it looked completely reasonable in review.
This is the shape of nearly every observability cost incident: a small, sensible-looking change to a label set.
The labels that cause it
Some values are unbounded by nature. Putting any of these in a metric label is how you get the 400% bill.
- User or customer identifiers. Grows with your business. This is the classic.
- Request or trace IDs. Unique per request. Every single request creates a new time series that is written once and never queried again.
- Raw URL paths.
/api/users/8f3a2band/api/users/c91e4dare different label values. Every user ID in a path becomes a series. - Email addresses, session tokens, order numbers. Same problem, and often a privacy issue on top.
- Container, pod, or instance IDs. Subtler and very common. In a Kubernetes environment with rolling deploys, pod names change on every release. Deploy ten times a day and you generate ten new sets of series daily, most of them dead within the hour but still stored, still indexed, still billed.
- Full error messages.
"connection refused to 10.0.4.19:5432"is not a label value."connection_refused"is. - Timestamps. Rare but catastrophic. Every scrape becomes a new series.
The pod-ID one deserves emphasis because it hides. Nobody deliberately adds it — it arrives by default from a Kubernetes service discovery config or an auto-instrumentation library, and it silently multiplies your entire metric set by your deploy frequency.
The rule that resolves it
Metrics, traces, and logs have different cost profiles, and the discipline is to put each dimension where it belongs.
Metrics are for low-cardinality aggregate questions. How many requests, how many errors, what’s the p99. Bounded labels only: service name, endpoint template, method, status class, environment, region. If a label’s value set could grow without limit, it does not belong on a metric.
Traces are for high-cardinality specifics. This is the correct home for user IDs, request IDs, order numbers, feature flag states, and full URLs. Span attributes are stored per-span, not as a cross-product, so adding an attribute costs you linearly rather than multiplicatively. The rule of thumb: anything you want to filter one request by belongs on a span; anything you want to graph over time belongs on a metric.
Logs are for detail, sampled and retained deliberately. Cheap per event, ruinous in aggregate. CloudWatch Logs bills around $0.50 per GB ingested; most vendors are comparable. A service logging every health check at debug level generates a remarkable amount of money’s worth of nothing.
Almost every cardinality problem we’ve debugged was a high-cardinality dimension that had been put on a metric when it should have been on a span.
Templating your paths
The single highest-value fix, and the one most often missed.
Auto-instrumentation frequently records the raw request path. You want the route template:
BAD:   http_requests_total{path="/api/users/8f3a2b/orders/119"}
GOOD:  http_requests_total{route="/api/users/{id}/orders/{order_id}"}
Most frameworks expose the matched route rather than the raw path — Express, FastAPI, Spring, Rails all do. Use it. The OpenTelemetry semantic conventions specify http.route for exactly this reason, and if your instrumentation is populating http.target into a metric label instead, that’s your bug.
While you’re there: use the semantic conventions generally. Naming your attributes http.request.method and service.name rather than inventing your own means your dashboards and alerts survive a change of vendor or instrumentation library, which is worth more than it sounds like the day you need it.
The Collector is your control point
Instrumenting every service to emit exactly the right data, and keeping it that way as forty developers commit, is not achievable. Put the enforcement somewhere central instead.
The OpenTelemetry Collector sits between your applications and your backend. Everything passes through it, which makes it the one place you can apply policy without touching application code.
Drop attributes before they reach the backend. An attributes processor can delete user.id and session.token from metrics while leaving them on spans. One config change, applied to every service.
Filter what you don’t need. Health check spans, /metrics scrapes, readiness probes. These are pure noise and they’re often a double-digit percentage of your span volume.
Batch. Reduces network overhead and, with per-request-billing vendors, directly reduces cost.
Switch backends without redeploying anything. Because your applications speak OTLP to the Collector and only the Collector knows about your vendor, changing vendors is a config change. This is the strongest practical argument for OpenTelemetry over vendor-specific agents, and it’s worth setting up before you need it, not during a contract renegotiation.
Run it as a DaemonSet for node-local collection, plus a gateway deployment for anything requiring a full view of a trace. That second part matters for the next section.
Sampling traces properly
You cannot afford to store every trace at any real volume. The question is which ones you keep.
Head sampling decides at the start of the request, usually with a fixed probability. Cheap, simple, and stateless — but it decides before knowing whether the request failed or took nine seconds. At 1% head sampling you throw away 99% of your errors, which are the traces you actually wanted.
Tail sampling buffers complete traces and decides after seeing the outcome. This is what you want:
- Keep 100% of traces containing an error
- Keep 100% of traces above a latency threshold
- Keep 100% of traces for low-traffic endpoints, which would otherwise vanish entirely
- Keep 1–5% of everything else as a healthy baseline
The result is that you store a small fraction of your volume while retaining essentially all of the diagnostically interesting traces. Ten to twenty times cost reduction with better debugging is not a typical trade in infrastructure, and it’s available here.
The catch: tail sampling requires all spans of a trace to reach the same Collector instance. That means a gateway tier with trace-ID-aware load balancing in front of it, and memory sized for your buffering window. It’s a real piece of architecture, not a config flag, but it’s a day’s work and it pays for itself immediately.
Log discipline
Three changes cover most of the waste.
Drop noise at the source. Health checks, readiness probes, and load balancer pings should be filtered at the agent or Collector, not ingested and then ignored. This is frequently 20–40% of log volume in a Kubernetes environment.
Structure your logs. JSON, with consistent field names, and the trace ID included so you can jump from a log line to the full trace. Unstructured logs force you to pay for full-text indexing to get anything back out.
Tier your retention. Seven days hot and searchable, ninety days in object storage for compliance, nothing beyond that unless a regulator says otherwise. Setting explicit retention on every log group matters because the default on most platforms is “keep forever,” which is almost never what anyone intended.
And the recurring one: audit your log levels in production. Debug logging left on after an incident is one of the most common causes of a sudden bill increase we see.
A quick audit
Half a day, and it usually finds most of it.
- Find your top series by cardinality. On Prometheus,
topk(20, count by (__name__)({__name__=~".+"}))shows which metric names generate the most series. On Datadog, the custom metrics breakdown does the same. The offender is usually obvious and usually a single metric. - Check your top ten metrics’ label sets. Any label whose value set could grow unboundedly is a finding.
- Grep for raw paths. Search dashboards and metric names for anything containing a UUID or a numeric ID.
- Measure health check traffic. As a proportion of total spans and log lines. If it’s over 10%, filter it today.
- Confirm your sampling strategy. If you’re head sampling at a low rate, you’re discarding errors. Move to tail sampling.
- List log groups with no retention policy. Set one on all of them.
The point isn’t just the bill
Cost is the visible symptom. The real damage from cardinality explosion is that queries slow down, dashboards time out, and your team stops using the observability stack during incidents because it’s too slow to be useful mid-outage. Cardinality discipline is a reliability practice that happens to also save money.
There’s a connection to targets here too. Your SLOs are computed from metrics, so a metric set that’s too expensive to query at speed is a burn-rate alert that fires late. And the same cost-attribution discipline that works on cloud infrastructure spend applies to telemetry: without knowing which service generates which cost, nobody owns reducing it.
If your observability bill has outgrown its usefulness, that’s the kind of thing our observability engagements start with. Send us the shape of your setup and we’ll tell you where it’s going.
Frequently asked questions
What is high cardinality in metrics?
Cardinality is the number of unique time series a metric produces, calculated as the product of all its label value counts. High cardinality means that product is large, usually because a label like user ID or request ID has an unbounded set of values. Cost and query latency scale with it.
Why did my Datadog or Prometheus bill increase without more traffic?
Almost always a new label with many possible values added to an existing metric, or auto-instrumentation recording raw URL paths instead of route templates. Both multiply your series count without changing request volume. Check which metric names produce the most series first.
Where should user IDs go if not in metric labels?
On span attributes. Traces store attributes per span rather than as a cross-product, so a user ID adds cost linearly rather than multiplicatively, and traces are the right tool for investigating individual requests anyway.
What is tail sampling and why is it better than head sampling?
Tail sampling decides whether to keep a trace after seeing the complete result, so you can retain all errors and slow requests while discarding most successful ones. Head sampling decides at the start and therefore discards errors at the same rate as everything else.
How much can we realistically cut observability costs?
Teams that have never audited cardinality typically find 40–70%, mostly from dropping unbounded labels, filtering health checks, and moving to tail sampling. Query performance usually improves at the same time.
Does OpenTelemetry lock us into a vendor?
No, and that’s largely the point. Applications emit OTLP to a Collector, and only the Collector is configured with your backend. Switching vendors is a Collector config change rather than a re-instrumentation project.

Suraj Kumar Aggarwal
Suraj Kumar Aggarwal is the founder of Drasken Labs, a Delhi NCR engineering firm building and operating custom software, cloud infrastructure, and observability for startups and scale-ups. He writes about the operational side of engineering — what systems cost, where they break, and how to see problems before customers do.
Need help implementing this in production?
Our team can help with architecture, cloud delivery, and performance improvements referenced in this article.