Website performance optimization is the work of making pages load, respond and stay visually stable fast enough that real visitors on real devices never notice the wait. In 2026, that goal has a precise definition: Google’s Core Web Vitals, measured on your actual traffic.
Here’s the problem most businesses run into. Someone runs a Lighthouse test, sees a score of 62, installs a caching plugin, re-runs the test, sees 71, and calls it done. Three months later, Search Console still flags the same pages as “Poor,” the site still feels sluggish on a mid-range Android phone, and nobody is sure why.
That happens because website performance optimization isn’t about a single score. It’s a set of budgets — for server time, bytes, JavaScript execution and layout — and a slow page is one that has blown through at least one of them. Optimization means finding which budget is overspent and fixing that one first.
This guide walks through the approach we use in website development projects at Drasken Labs: what to measure, where the time usually goes, the fixes for each Core Web Vital, and how to keep a site fast after launch. If you’re still scoping a new site, performance is also one of the factors that shapes what a professional business website costs.
Short answer: Measure field data first (PageSpeed Insights or Search Console), not lab scores. Fix server response time and the Largest Contentful Paint element before anything else. Then cut JavaScript — especially third-party scripts — to fix responsiveness, reserve space for every image, embed and font to stop layout shifts, and set performance budgets so regressions get caught before release.
What website performance optimization actually measures
A fast website isn’t one that gets a green number in a testing tool. It’s one where visitors experience three things:
- The main content appears quickly. The visitor can see the headline, hero image or product within a couple of seconds.
- The page responds immediately. Tapping a menu, a filter or a form field produces visible feedback without a lag.
- Nothing jumps around. Buttons don’t move just as someone goes to tap them, and text doesn’t shift when an ad or font loads.
Google formalized these three experiences as the Core Web Vitals. They are part of Google’s page experience signals in search, but they matter just as much for conversion: a lead form that lags or shifts under someone’s thumb loses enquiries regardless of where the page ranks.
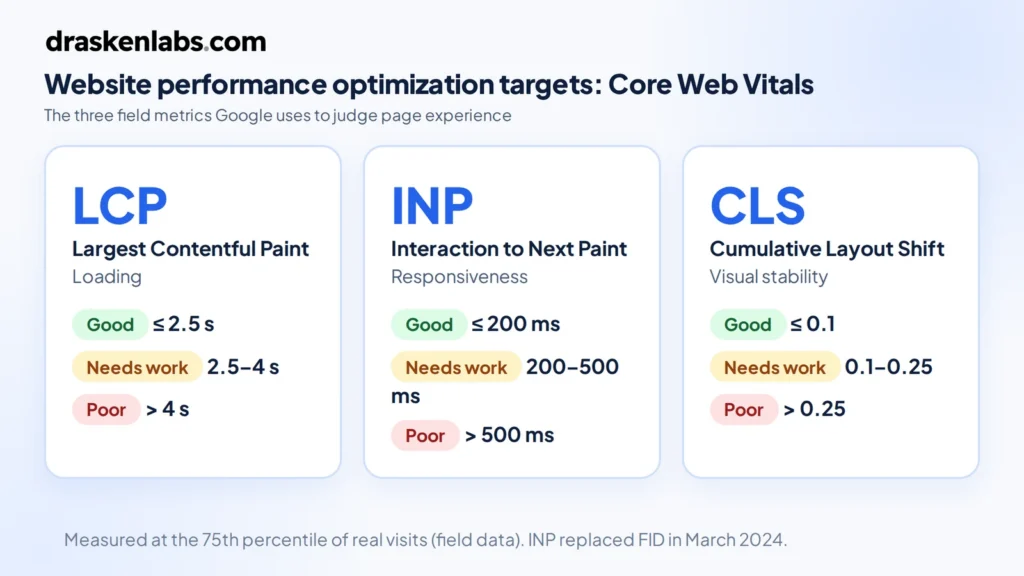
Core Web Vitals in 2026: the three numbers that matter
| Metric | Measures | Good | Needs improvement | Poor |
|---|---|---|---|---|
| LCP — Largest Contentful Paint | Loading: when the largest visible element renders | ≤ 2.5 s | 2.5–4.0 s | > 4.0 s |
| INP — Interaction to Next Paint | Responsiveness: delay between an interaction and the next visual update | ≤ 200 ms | 200–500 ms | > 500 ms |
| CLS — Cumulative Layout Shift | Visual stability: unexpected movement of content | ≤ 0.1 | 0.1–0.25 | > 0.25 |
Three details matter more than the thresholds themselves:
- They’re measured at the 75th percentile. A page passes only if at least 75% of real visits meet the “good” threshold. Your fast office connection is irrelevant; the visitor on a crowded 4G network is not.
- INP replaced First Input Delay in March 2024. FID only measured the delay before the first interaction was processed. INP looks at interactions across the whole visit, which makes it considerably harder to pass on JavaScript-heavy sites.
- The thresholds haven’t changed. You may see claims that Google tightened LCP to 2.0 seconds. Google’s documentation still says 2.5 seconds. Aiming lower is a sensible safety margin, not a new rule.
Lab data vs field data: why a 95 score can still fail
There are two kinds of performance data, and confusing them is the most common reason website performance optimization work goes nowhere.
Lab data comes from tools like Lighthouse, which load a page once in a simulated environment. It’s reproducible and useful for debugging, but it’s one synthetic visit on one simulated device.
Field data comes from real Chrome users, collected in the Chrome User Experience Report (CrUX) over a rolling 28-day window. This is what Search Console reports and what Google uses for page experience. PageSpeed Insights shows both, with field data at the top when your site has enough traffic.
A page can score 95 in Lighthouse and still fail INP in the field, because Lighthouse doesn’t click on anything. Real users do — and the chat widget, analytics tags and consent banner that sat idle during the lab test all compete for the main thread when a real visitor starts tapping.
Use field data to decide what to fix. Use lab data to figure out why it’s slow and to verify fixes before they ship.
Where the time actually goes: a diagnostic order
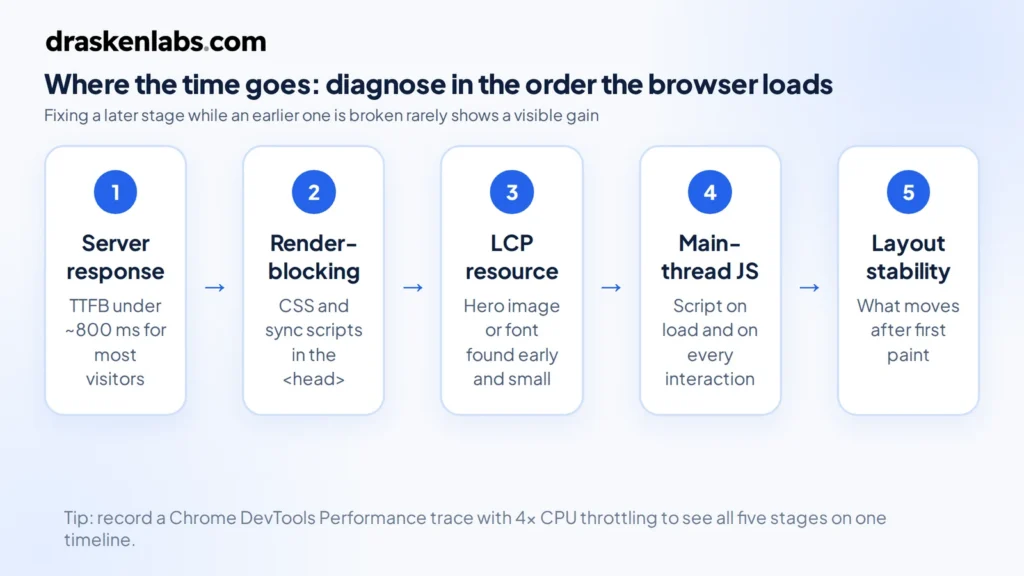
When we audit a slow site, we work through the page load in the order the browser experiences it. Fixing a later stage while an earlier one is broken usually produces little visible improvement.
- Server response (TTFB). How long before the first byte of HTML arrives? If this is over roughly 800 ms for most visitors, nothing downstream can fully compensate.
- Render-blocking resources. CSS and synchronous scripts in the
<head>that must download before anything paints. - The LCP resource. Is the hero image or headline font discovered early, prioritized, and small enough?
- Main-thread JavaScript. How much script runs during load and on each interaction, and whose code is it?
- Layout stability. What moves after the first paint, and why?
The Performance panel in Chrome DevTools shows all five on a single timeline. Record a load with CPU throttling set to 4x slowdown to approximate a mid-range phone; problems that are invisible on a developer laptop become obvious.
How to fix Largest Contentful Paint (LCP)
LCP is usually the hero image, a large heading, or a background image. Break its time into four parts — server response, resource discovery, download, and render — and fix whichever part dominates.
Make the LCP image discoverable and high priority
The browser can’t start downloading an image it hasn’t found yet. Images set via CSS backgrounds, injected by JavaScript sliders, or lazy-loaded are found late. Use a plain <img> in the HTML and tell the browser it matters:

Never add loading="lazy" to the LCP image. Lazy loading is for images below the fold; on the hero, it delays exactly the element Google is timing.
Serve the right format at the right size
- Use AVIF or WebP, with JPEG as a fallback where your pipeline requires it.
- Serve responsive sizes through
srcsetso a phone doesn’t download a 2,400-pixel desktop image. - Compress properly. A hero image rarely needs to exceed 150–250 KB.
Remove render-blocking work
- Inline the critical CSS needed for above-the-fold content and load the rest without blocking.
- Add
deferto scripts that don’t need to run before the first paint — which is most of them. - Self-host fonts, subset them to the characters you use, preload the one or two files needed for the first screen, and use
font-display: swaporoptional.
Choose a rendering strategy that fits the page
If the HTML is generated by client-side JavaScript, the LCP element doesn’t exist until that JavaScript downloads and runs. For content pages, that’s an avoidable delay.
| Strategy | How it works | Best for |
|---|---|---|
| Static generation (SSG) | HTML built ahead of time and served from a CDN | Marketing pages, blogs, documentation |
| Incremental regeneration (ISR) | Static pages rebuilt in the background on a schedule or on publish | CMS-driven sites, product catalogs |
| Server-side rendering (SSR) | HTML generated per request | Personalized or frequently changing pages |
| Client-side rendering (CSR) | Browser builds the page from JavaScript | Logged-in app screens where SEO doesn’t matter |
A business website with a headless CMS usually belongs in the first two rows. Serving a marketing page as a client-rendered single-page app is one of the most expensive performance mistakes we see.
How to fix Interaction to Next Paint (INP)
INP fails when the browser’s main thread is busy at the moment a visitor interacts. The browser can only do one thing at a time on that thread; if a 400 ms script is running when someone taps “Menu,” the tap waits.
Ship less JavaScript
The most effective INP fix is removing code, not optimizing it. Audit the bundle and ask of each dependency whether the page needs it at all. Carousels, animation libraries and full UI frameworks often ship on pages that use a fraction of them.
Break up long tasks
Any task over 50 ms blocks interactions. Split heavy work into smaller chunks and yield back to the browser between them, so input can be handled in the gaps. In event handlers, do the visual update first — open the menu, show the spinner — and defer the analytics call or data processing until after the next paint.
Reduce hydration cost
Frameworks that render on the server and then “hydrate” in the browser can re-run large amounts of code on load. Partial hydration, server components, and loading interactive islands only when they scroll into view all reduce that cost.
Keep the DOM reasonable
Very large DOMs make every style recalculation and layout slower. Pages with many thousands of nodes — often from page builders or mega-menus rendered in full on every page — take longer to update after each interaction.
How to fix Cumulative Layout Shift (CLS)
CLS is usually the easiest vital to fix, because the causes are predictable:
- Images and videos without dimensions. Always set
widthandheightattributes, or use CSSaspect-ratio, so the browser reserves space before the file arrives. - Embeds, ads and iframes. Give their containers a fixed minimum height.
- Injected banners. Cookie notices, promo bars and “download our app” prompts that push content down. Overlay them instead of inserting them above content.
- Web fonts. A fallback font with different metrics causes text to reflow when the web font loads. Use size-adjusted fallbacks so both fonts occupy the same space.
- Animations. Animate
transformandopacity, nottop,heightormargin.
Server, hosting and caching
Front-end work can’t rescue a slow origin. If time to first byte is high, look here first.
- Put a CDN in front of everything. Static assets and, where possible, full HTML pages should be served from an edge location near the visitor. For a business serving India, the Gulf and Australia from one origin, this alone can remove hundreds of milliseconds.
- Set proper cache headers. Fingerprinted assets (
app.3f9a2c.js) can be cached for a year withCache-Control: public, max-age=31536000, immutable. HTML needs shorter lifetimes or revalidation. - Enable Brotli compression and HTTP/3 on your CDN or reverse proxy.
- Fix slow backend queries. On dynamic sites, TTFB problems often trace back to unindexed database queries, N+1 query patterns, or uncached API calls to third-party services on every request.
- Add an object cache. Redis or a similar cache in front of expensive queries keeps response time flat under load.
None of this requires a complicated platform. A slow marketing site is almost never a container orchestration problem, and you probably don’t need Kubernetes to fix it. What it needs is correct managed hosting and CDN setup. There’s a cost benefit too: serving cached assets from the edge reduces origin load and egress, which is one of the easier wins in cloud cost optimization.
Third-party scripts: the performance budget nobody owns
On many business websites we audit, the site’s own code is not the biggest problem. Third-party scripts are: analytics, tag managers, advertising pixels, heatmaps, A/B testing tools, chat widgets, review badges and social embeds.
Each one was added by a different person for a sensible reason, and none of them were ever removed. Together they can easily account for most of the JavaScript executed on a page — and they run on the same main thread as your menu and forms.
- Inventory every tag and name an owner for each. If nobody can say what a script is for, remove it.
- Load non-essential scripts after the page becomes interactive, or on first user interaction.
- Use facades for heavy embeds. Show a static preview of a chat widget or video player and load the real thing only when clicked.
- Consider server-side tagging for analytics and ad conversions, which moves work off the visitor’s device.
- Treat the tag manager as production code. Changes there can undo weeks of website performance optimization work in one publish.
WordPress performance: specific traps
WordPress powers a large share of business websites, and it can be very fast. It usually isn’t, for a few recurring reasons:
- Plugin accumulation. Every plugin can add its own CSS, JavaScript and database queries — often on every page, whether used there or not.
- Page builders. Visual builders tend to produce deep, heavy markup and large style sheets. They trade development speed for runtime cost.
- Stacked optimization plugins. Two caching or minification plugins fighting each other is common, and it often breaks things rather than speeding them up.
- No persistent object cache. Without Redis or Memcached, WordPress re-runs the same queries on every uncached request.
- Cheap shared hosting with slow PHP workers, which shows up directly as high TTFB.
For content-heavy sites where performance is a priority, a headless setup — WordPress as the editing interface, with a static or incrementally regenerated front end served from a CDN — removes most of these problems. It’s the architecture we run for our own site. Where the site needs logic beyond content, such as portals, bookings or integrations, that becomes custom software development rather than theme configuration.
Keeping it fast: budgets and monitoring
Performance decays. A new hero video, a marketing tag, a plugin update — each one small, and six months later the site is back where it started. The fix is to treat website performance optimization as a constraint that’s checked continuously, not a project that ends.
Set performance budgets
Define limits that fail a build or block a release when exceeded. For example:
- LCP under 2.0 s in lab tests on a throttled mobile profile
- Total JavaScript under 200 KB compressed for content pages
- No single image over 250 KB
- No new third-party origin without review
Lighthouse CI can run these checks on every pull request.
Collect real-user monitoring
CrUX data arrives with a 28-day lag and only at page-group level. Real-user monitoring (RUM) — sending Core Web Vitals from your visitors’ browsers to your own analytics — shows regressions within hours and tells you which device, page type and element is responsible.
One warning from experience: tag RUM data by page template or route (/blog/[slug]), not by full URL, user ID or session. Unbounded labels are how a monitoring setup turns into a surprise bill, which we covered in detail in our piece on high-cardinality metrics.
Pair RUM with alerting — for example, notify the team when p75 LCP on product pages exceeds 2.5 s for an hour — and performance becomes something you see before customers do. That’s the same principle behind the observability work we do for application backends, applied to the front end.
A 30-day website performance optimization plan
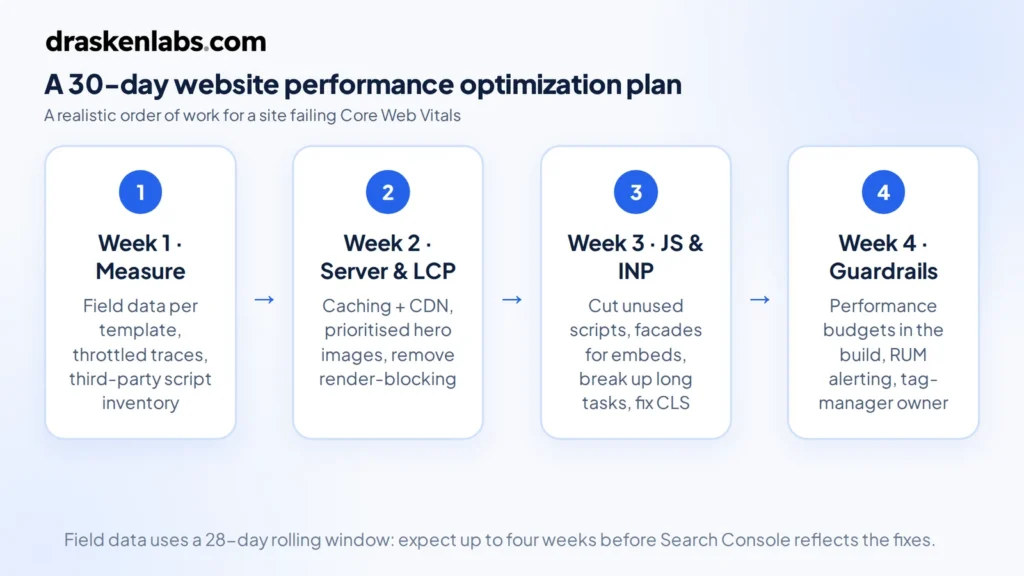
If you’re starting from a site that’s failing Core Web Vitals, this is a realistic order of work:
- Week 1 — Measure. Pull field data from Search Console and PageSpeed Insights for your key templates: home, service pages, blog posts, product or landing pages. Record a throttled DevTools trace of each. Inventory every third-party script.
- Week 2 — Server and LCP. Fix TTFB with caching and a CDN. Make LCP images discoverable, prioritized and properly sized. Remove render-blocking CSS and scripts.
- Week 3 — JavaScript and INP. Remove unused scripts and dependencies, defer the rest, add facades for heavy embeds, and break up long tasks in your own code. Fix CLS causes in the same pass.
- Week 4 — Guardrails. Add performance budgets to the build, set up RUM and alerting, and document who owns the tag manager.
Expect field data to take up to four weeks to reflect the changes, because of CrUX’s rolling window. Watch your RUM data in the meantime.
How Drasken Labs approaches website performance
We treat website performance optimization as an engineering constraint from the start of a project, not a plugin added at the end. In practice, that means:
- Architecture first. Choosing a rendering strategy and hosting setup that suits each page type before any design is built.
- Budgets in the build. Performance limits enforced in CI, so regressions are caught in review rather than in Search Console.
- Infrastructure we operate. CDN, caching and hosting configured and run by the same team that built the site.
- Monitoring after launch. Real-user Core Web Vitals tracked per template, with alerts when something slips.
For existing sites, we start with a performance audit: field data, traces of key templates, and a third-party script inventory, ending in a prioritized list of fixes with expected impact. You can see how we build and run sites in our recent work.
Is your website failing Core Web Vitals?
Send us the URL and your key pages. We’ll tell you where the time is going and what to fix first.
Final thoughts
Website performance optimization isn’t about chasing a perfect Lighthouse score. It’s about making sure the visitor on an average phone and an average network sees your content quickly, can interact with it immediately, and isn’t fighting a page that moves under their thumb.
The order matters: measure real users, fix the server and the LCP element, cut JavaScript — especially scripts you didn’t write — stabilize the layout, and then put budgets and monitoring in place so the work doesn’t quietly unravel.
Most sites don’t need a rebuild to pass Core Web Vitals. They need someone to find the two or three budgets that are overspent and fix those first.
Sources and further reading
- Web Vitals — web.dev (Google)
- Largest Contentful Paint (LCP) — web.dev
- Interaction to Next Paint (INP) — web.dev
- Cumulative Layout Shift (CLS) — web.dev
- Understanding Core Web Vitals and Google search results — Google Search Central
- Chrome UX Report — Chrome for Developers
Frequently asked questions
What is website performance optimization?
Website performance optimization is the process of improving how quickly a website loads, how fast it responds to interactions, and how visually stable it is while loading. In practice, it’s measured with Google’s Core Web Vitals: Largest Contentful Paint, Interaction to Next Paint and Cumulative Layout Shift.
What are good Core Web Vitals scores in 2026?
A page is rated “good” when LCP is 2.5 seconds or less, INP is 200 milliseconds or less, and CLS is 0.1 or less, measured at the 75th percentile of real visits.
Does website speed affect SEO?
Yes, but modestly. Core Web Vitals are part of Google’s page experience signals, which act more like a tie-breaker between similarly relevant pages than a primary ranking factor. Speed has a larger and more direct effect on bounce rate and conversion.
Why is my PageSpeed score high but Core Web Vitals still failing?
The PageSpeed score is lab data from one simulated visit. Core Web Vitals in Search Console are field data from real users over 28 days. Real visitors use slower devices and networks, and they interact with the page, which exposes INP problems that lab tests don’t trigger.
How long does it take for Core Web Vitals improvements to show?
Field data in the Chrome User Experience Report uses a rolling 28-day window, so improvements typically take up to four weeks to be fully reflected in Search Console and PageSpeed Insights.
Will a caching plugin fix a slow WordPress site?
It helps with server response time, but it doesn’t fix heavy JavaScript, unoptimized images, layout shifts or third-party scripts. Most WordPress sites that fail Core Web Vitals need changes to plugins, themes and scripts, not just caching.
How much does website performance optimization cost?
It depends on the cause. Fixing images, caching and a handful of scripts is a small, contained engagement. If the site is built on a heavy page builder or renders content client-side, meaningful gains may require rebuilding key templates. An audit is the fastest way to find out which case you’re in.
Written by
Aarav Mehta
Aarav Mehta writes for the Drasken Labs blog on cloud infrastructure, Kubernetes, observability, and practical engineering decisions for growing businesses. Articles are reviewed by the Drasken Labs engineering team before publishing.